What an average is worth
An averaged PSD is an estimate. Averaging more frames steadies it, and how steady it is can be stated as a number: its statistical degrees of freedom. From that number follows a confidence band, the range around the averaged spectrum that the true spectrum lies in at a stated confidence. Visual Dynamics works out both from the averaging that produced the PSD, shows them in the Averaging view while the averaging is being set, and shades the band on the PSD with the Confidence reading.
These degrees of freedom are statistical. They are not the measurement DOFs, the node and direction, that a channel is taken at.
Two per frame, fewer when frames overlap
A single frame's spectrum has two degrees of freedom at each line, the real and the imaginary part of the line's transform. An average of n frames that share no samples has 2n. This is the nominal count, shown as Stat. DOF (2n).
Frames that overlap share part of the record, so they vary together, and an average of them steadies less than the same number of independent frames would. Welch's method gives the discount: the variance of the average grows by a factor of
1 + 2 * sum over j of (1 - j/n) * c(j)**2
where c(j) is how much the window lets two frames j hops apart share (their overlap correlation), and the equivalent count is 2n divided by that factor. This is shown as Equivalent DOF. With no overlap the two counts are equal.
The window matters, because a tapered window gives little weight to the samples two overlapped frames share. For many frames, the equivalent count as a share of the nominal is:
| Window | No overlap | Half overlap | Three-quarter overlap |
|---|---|---|---|
| Hann | 1.00 | 0.95 | 0.52 |
| Rectangle | 1.00 | 0.67 | 0.36 |
A Hann window at half overlap shares a sixth of its weight with its neighbor, so overlapping costs almost nothing and doubles the frames a record holds. At three-quarter overlap each frame is worth about half, but there are twice as many again, so the record yields only slightly more than at half overlap.
A capture that a controller saved one record per average is counted the same way: the records are separate pieces of signal, so each one adds its frames' count in full. Twenty records of one frame each are forty degrees of freedom.
The band
An averaged autospectrum is the true spectrum times a chi-square variable divided by its degrees of freedom. So at each line the true value lies between two multiples of the averaged one, at a stated confidence. The band is not symmetric: it reaches further above the estimate than below it, because an average of few frames reads low more often than it reads high. In decibels from the averaged value:
| Degrees of freedom | 90 % band | 95 % band |
|---|---|---|
| 2 | −4.8 / +12.9 dB | −5.7 / +16.0 dB |
| 10 | −2.6 / +4.0 dB | −3.1 / +4.9 dB |
| 20 | −2.0 / +2.7 dB | −2.3 / +3.2 dB |
| 50 | −1.3 / +1.6 dB | −1.5 / +1.9 dB |
| 100 | −0.9 / +1.1 dB | −1.1 / +1.3 dB |
| 200 | −0.7 / +0.8 dB | −0.8 / +0.9 dB |
The band is worked out from the equivalent count. Worked out from the nominal count instead, an overlapped average's band is too narrow and holds the true spectrum less often than it claims.
The confidence is line by line. On a spectrum of a thousand lines, a 90 percent band leaves about a hundred lines whose true value is outside it, by chance alone. A line outside the band is not by itself a sign that anything is wrong.
In the Averaging view
Below the settings, beside Averages, the view shows Stat. DOF (2n), Equivalent DOF, and the 90 % band in decibels that the equivalent count gives. They follow every change to the frame length, overlap, window and frame count, and every drag of the analyzed span, so the cost of a setting is seen while it is chosen. A PSD computed with Compute PSDs carries the same count.
On a PSD
A PSD computed from a time history carries each channel's equivalent
count as statistical_dof, and it is saved with the project. From it,
Psd.confidence_band gives the band's two edges as PSDs in the
spectrum's own units, and marks='confidence' draws the band on the
plot, at 90 and 95 percent unless other levels are given:
import visualdynamics
from visualdynamics.core.averaging import Averaging

run = visualdynamics.random_vibration_run('run.nc4')
history = run.time_history
history.averaging = Averaging(frame_length=512, overlap=0.75,
                              window='hann', frames=16)
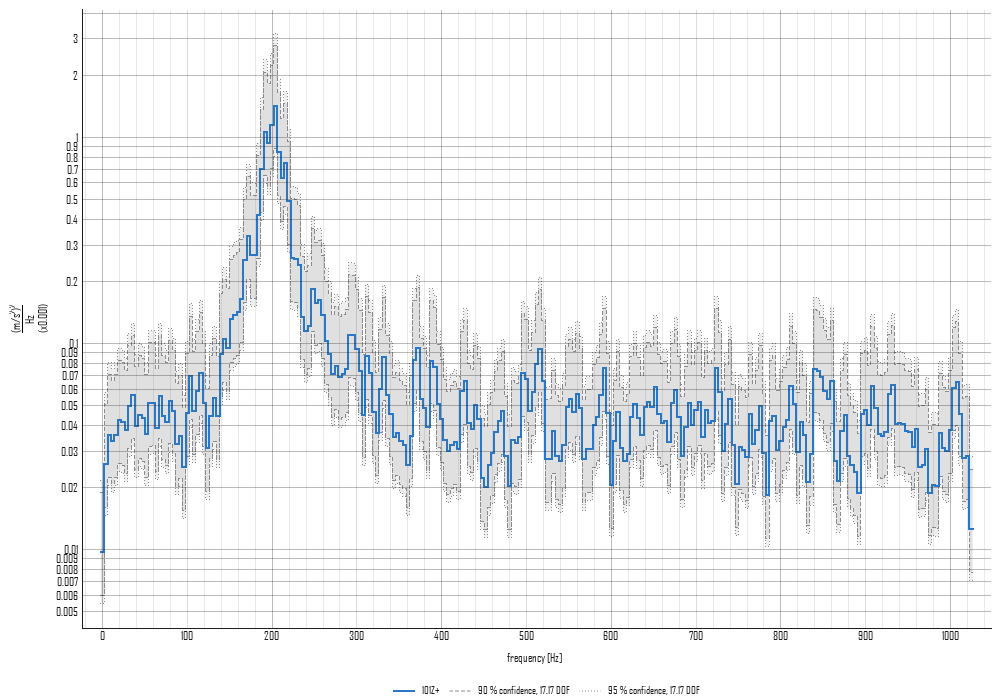
print(history.averaging.statistical_dof())
# StatisticalDof(frames=16, nominal=32, equivalent=17.17...)

psd = history.compute_psds()
lower, upper = psd.confidence_band(0.90)     # two PSDs, same units
psd.plot(marks='confidence', records=[0], path='band.png', show=False)
The functions underneath are in visualdynamics.core.averaging:
statistical_dof and frame_correlation for the count, and
chi_square_factors and confidence_bands for the band, on plain
arrays. line_correlation gives how the window ties neighboring lines
together, which a sum of adjacent lines is worth less for
(Lines outside a band by chance); a computed
PSD carries it as Psd.line_correlation.
The legend names each band with its confidence and the count it was worked out at, such as 90 % confidence, 17.17 DOF, and each level's edges are dashed their own way, so two levels on one plot are told apart by line style as well as by name. Records averaged to different counts are named by the range they span.
Psd.confidence_reading gives the same band as numbers, one per
record: the confidence, the count, the two factors and the edges in
decibels, which describe puts in words:
band = psd.confidence_reading(0.95)[0]
print(band.describe())
# 95 % band at 17.17 DOF: -2.5 / +3.5 dB
The Confidence reading
Select an averaged autospectrum and press Confidence on the bar, beside Octave Bands and Tones. The band is shaded on the plot, and the pane beside it sets and says what the band is:
- Confidence: 90 % or 95 %. The choice is kept for every spectrum drawn after it.
- DOF: as averaged takes the spectrum's own equivalent count. A number typed here is used instead, for this spectrum: the way to read the band on a spectrum read from a file, at the count the system that averaged it reports.
- Below the rule: where the count came from (the averaging, typed or not known), the channel the rows read (the first one drawn that has a finite line above zero; a dead channel has no band and the note names it), the Equivalent DOF, the band's edges Below and Above the estimate in decibels, and the same edges as Factors. A note under them says what the confidence means line by line, and says so when the records drawn were averaged to different counts.
The status line gives the band in words. A spectrum that carries no
count and has none typed draws no band, and the pane asks for one: a
band is never guessed. A cross-spectrum and a specification have no
band, whatever count is given: a specification is a target, not an
average, and that includes the PSD of a transient specification, which
carries the count it was averaged to. Psd.confidence_refusal says
why, the band and the plot raise it, and the app does not offer the
reading. Like every reading, the view is journaled as the call that
draws it:
with dof= added when a count was typed, and records= when only
some channels are drawn.
What has no count, and what the count leaves out
A spectrum read from a file or banded onto octaves carries no count,
because its count is not the one its source frames had: banding sums
lines and raises the count. Its band is refused rather than guessed.
Pass the count yourself when you know it, as
psd.confidence_band(0.9, dof=...) or
psd.plot(marks='confidence', dof=...), or type it in the Confidence
reading's pane. Spectra merged into one keep their counts, record by record,
when every one of them has a count; if any of them lacks one, the
merged spectrum has none.
The band belongs to an autospectrum. A cross-spectrum, an FRF and a coherence have errors that follow other laws, and a PSD holding cross terms is refused.
The count is the one the spectrum's interior lines have. The line at zero, and the line at the Nyquist frequency for an even frame, are real and carry half as many degrees of freedom, and removing each frame's mean or trend costs the lowest lines a little more. The band is read between them.