Deriving a specification from field data
A random or shock specification written from measurements starts as a
set of spectra: one PSD or SRS per flight, per run, per event, or per
segment of a mission. No two are alike, so the specification is written
over a statistical limit of the set, a level at each frequency that the
next member of the set is not expected to exceed, and the limit is then
covered by a few straight lines on log-log axes. Those lines are the
breakpoint table a laboratory receives. core.field_limit makes both
steps reproducible and says on each result what it rests on.
The set
gather reads the records onto common lines: the records of one PSD or
SRS, every record of several, or chosen (object, record) pairs.
Records that cannot be read one way are refused, each with its cause
named:
- records of different quantities, or with units declared on one side and not the other;
- a PSD mixed with an SRS, two SRSs at different Q or of different kinds, a cross spectrum, or a specification (a requirement, not a measurement);
- frequency ranges with nothing in common, or a band reaching past the range every record covers;
- a NaN, or a level at zero or below, at a line inside the band. A level of zero has no logarithm, and a dead channel is not a quiet flight.
Records on different lines are read onto the first record's lines over the range they share, log-log between their own lines, and the result notes it. The 0 Hz line is left out, since a level on log axes needs a positive frequency.
The limits
The levels are taken in decibels, 10 log10 of a density for a PSD and 20 log10 of a peak for an SRS. At each line, over the n records:
| Statistic | The limit | What it rests on |
|---|---|---|
envelope |
the largest record | nothing about the distribution |
distribution_free |
the largest record, as a limit at a stated coverage and confidence | independent records, and at least ln(1 − confidence) / ln(coverage) of them |
mean_k |
the mean in dB plus k standard deviations |
the standard deviation estimated from the records |
tolerance |
the normal tolerance limit, the mean plus a factor times the standard deviation | the levels log-normal across records (normal in dB) |
Whatever the distribution, the largest of n independent records stands above a share p of the population with probability 1 − pⁿ: eight records give 34 percent at 95 percent coverage, and a distribution-free limit at 95 percent coverage and 50 percent confidence needs 14. A set smaller than that is refused with the count it needs.
The normal tolerance limit stands above a share coverage of the
population with probability confidence. With the standard deviation s
estimated from n records, the limit is the mean plus k s, where
with z_p the normal quantile at the coverage and t′ the quantile at the confidence γ of the noncentral t distribution. Ten records at 95 percent coverage and 95 percent confidence give k = 2.911; eight at 95 and 50 give 1.719. At 50 percent confidence the factor falls toward z_p = 1.645 as the set grows.
When the set is too small to estimate a standard deviation, one can be
stated (sigma_db), and it is then taken as known: the factor is
z_p + z_γ / √n. One record with 3 dB stated gives a limit 1.645 × 3 =
4.9 dB above it at 95 percent coverage and 50 percent confidence, and
(2.326 + 1.282) × 3 = 10.8 dB at 99 percent and 90 percent. The result
says the scatter was stated and not measured.
The envelope over the limit
fit_envelope covers the limit with straight lines on log-log axes by
stated rules. The lines are at or above the limit at every line. The
breakpoints are at lines of the limit with their levels free, set so
the lines stand as little above the limit as they can on average over
log frequency. Breakpoints are added, each where the span that
over-tests most turns, until no line is more than max_overshoot_db
under the envelope or max_breakpoints is reached; the result says
when the allowance was not met, by how much and where. Breakpoints the
allowance does not need are then removed. The area the envelope adds
over the limit is reported in decibels.
A narrowband limit is ragged from line to line, and lines that stay
within a few decibels of every valley need a breakpoint at almost every
other line. The limit of spectra banded onto octaves first
(Psd.to_octave) is the one a few lines can follow.
A cover always raises the rms. With rms='conserve' (a PSD only, since
an SRS has no area) the covering lines are lowered until the envelope's
area is the limit's, and the lines where it then falls below the limit
are counted with the deepest named.
The margin a document asks for is added when the specification is
written, in decibels on the same convention: EnvelopeFit.specification
gives a Specification at the breakpoints for a PSD (with the starter
bands of the specification sheet) or a ShockSpecification at the
SRS's own Q, kind and spacing for an SRS.
A script
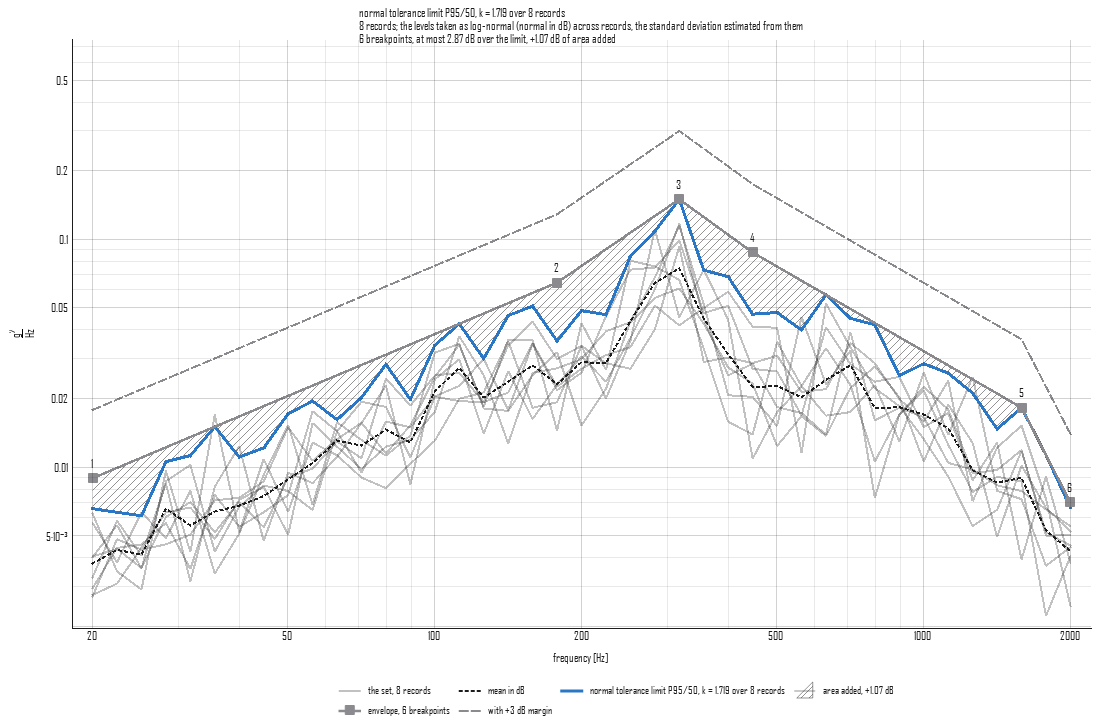
Eight flights on sixth-octave lines, with a resonance near 300 Hz and 1.5 dB of scatter from flight to flight:
from visualdynamics.core.field_limit import derive
from visualdynamics.plot import plot_field_limit

fit = derive(flights, statistic='tolerance', coverage=0.95,
             confidence=0.5)
print(fit.limit.describe())
# normal tolerance limit P95/50, k = 1.719 over 8 records
print(fit.limit.rests_on)
# 8 records; the levels taken as log-normal (normal in dB) across
# records, the standard deviation estimated from them
print(fit.describe())
# 6 breakpoints, at most 2.87 dB over the limit, +1.07 dB of area added
fit.frequencies          # 20, 178.3, 317, 447.7, 1588.7, 2000 Hz
spec = fit.specification(margin_db=3.0)

plot_field_limit(flights, statistic='tolerance', coverage=0.95,
                 confidence=0.5, margin_db=3.0, path='field-limit.png')
The same set asked for a distribution-free limit is refused, since eight records are not enough for it:
derive(flights, statistic='distribution_free')
# ValueError: the largest of 8 records stands above 95% of the
# population with only 34% confidence; a distribution-free limit at 95%
# and 50% needs at least 14 records
Project.derive_specification writes the specification into a project,
linked to the set and recorded so that it is worked out again when the
set changes (Project.refresh); Project.field_limit gives the same
reading without adding anything.
In the app
Select a plain PSD or SRS, or several of one kind, and press Field Limit on the bar. The set is drawn with the limit and the envelope as above, and the panel beside it holds the settings (the limit, its coverage and confidence or k, a standard deviation to state, the overshoot allowed, the most breakpoints, whether the rms is exceeded or kept, and the margin) and reads out the records, the factor, the scatter, the breakpoints, the overshoot, the rms of the limit and of the envelope, the area added, what the limit rests on and the notes. A refusal is said in their place. Make Specification adds the specification the reading shows, with its margin, beside the set.