Predicting the notch before the test
A limit channel is a response channel with a ceiling: a limit profile, an autospectrum the response at that point may not exceed. The controller holds its control channel to the reference everywhere in the band except where doing so would put a limit channel over its profile. There it lowers the drive until the limit channel sits on its profile, and the control channel falls below the reference over those lines. That dip is the notch. It is a change to the test, since the article receives less than the requirement asked for in that band, so it is agreed with whoever owns the requirement before the run: its band, its depth in decibels and as a ratio, and the channel that cuts it.
The low-level run is where the numbers for that conversation come from. With one drive, every channel at a line moves in proportion to the control channel, by the transmissibility \(T\) from the control channel to it, so a transmissibility measured at low level predicts each response at full level:
with \(G_\text{ref}\) the reference. Where \(R\) is over the limit profile \(L\), the control has to come down to \(L/|T|^2\) for that channel to sit on its limit, and the control the controller can hold is the lowest that every limit channel allows:
The notch's depth at a line is \(10\log_{10}(G_\text{ref}/G_\text{ctrl})\) decibels on the ASD and its ratio \(G_\text{ctrl}/G_\text{ref}\). A limit channel twice over its profile cuts a notch 3 dB deep, a ratio of a half; four times over, 6 dB, a quarter of the ASD and half the rms. Each notch is then read against the tolerance: where \(G_\text{ctrl}\) falls under the lower edge of the abort pair (or the warning pair, if that is chosen), the notch takes the control outside its tolerance, and the test as written cannot be run on this setup without a written departure from it.
Every curve is read over each line's bin the way a comparison reads a specification, so a predicted control judged against the specification as a measured one would be falls outside its tolerance at the same lines. Outside the reference nothing is predicted, and outside a limit profile nothing is limited.
This is a prediction, made once: the notch a controller would settle on if the article stayed linear from the low level to full level. It does not iterate a control loop, and three things make the notch cut differ from it. A controller cannot cut a notch only a line or two wide, so a narrow one comes out wider. Joints and isolators usually damp more and soften as the level rises, so a sharp low-level peak is often lower, and a little lower in frequency, at full level, and the predicted notch deeper than the one cut. And a limit channel that would notch most of the band is, in effect, the control, and whether the test as written exists on this setup is a question for the requirement's owner before the run. The reading says so where any of these applies.
From a script
transmissibility = history.compute_frfs(references=['1Z+'], method='H1')
prediction = visualdynamics.core.limit_prediction.predict_limits(
    transmissibility, specification, profiles)
prediction.verdict()
# 2 notches in the control at full level, the deepest 6.4 dB at 248.8 Hz
# for 2Z+; 1 of them takes the control outside the abort tolerance
notch = prediction.deepest
notch.low, notch.high                 # 233.75, 263.75 Hz, 25 lines
notch.depth_db, notch.ratio           # 6.44 dB, 0.227 of the reference
notch.level                           # the control left, SI
notch.outside, notch.beyond_db        # True, 3.4 dB under the abort edge
prediction.channels[0].worst          # 2Z+ 6.4 dB over at 248.8 Hz
prediction.table()                    # a row a notch, as text

visualdynamics.plot.plot_limit_prediction(
    transmissibility, specification, profiles, path='notch.png')
transmissibility holds one record per response channel, each taken
against the one control channel (H1 from the low-level run, or any FRF
from the control channel's quantity: an interface force over the
control acceleration predicts a force limit channel the same way).
specification holds the reference at the control channel, with its
tolerance. profiles holds the limit profiles, one autospectrum per
limit channel at that channel's DOF; left out, they are read from the
specification's own records at the response channels. A response
channel with no limit profile is predicted and does not notch.
tolerance='warning' reads the notches against the warning pair.
The prediction is refused, with the reason, for transmissibilities taken against more than one channel, a specification with nothing at the control channel, quantities that cannot be compared (an FRF against a force read beside an acceleration specification, a force profile against an acceleration channel, or units declared on one side only), a specification or profile on octave bands, which says nothing about the lines under its bands, and a set in which no response channel has a limit profile. A limit channel whose transmissibility is zero at every line recorded nothing; it is named and not judged, and a prediction whose every limit channel is like that says it judged nothing rather than that no notch is needed. A line where a transmissibility holds a value that is not a number is not predicted, and the notes count it.
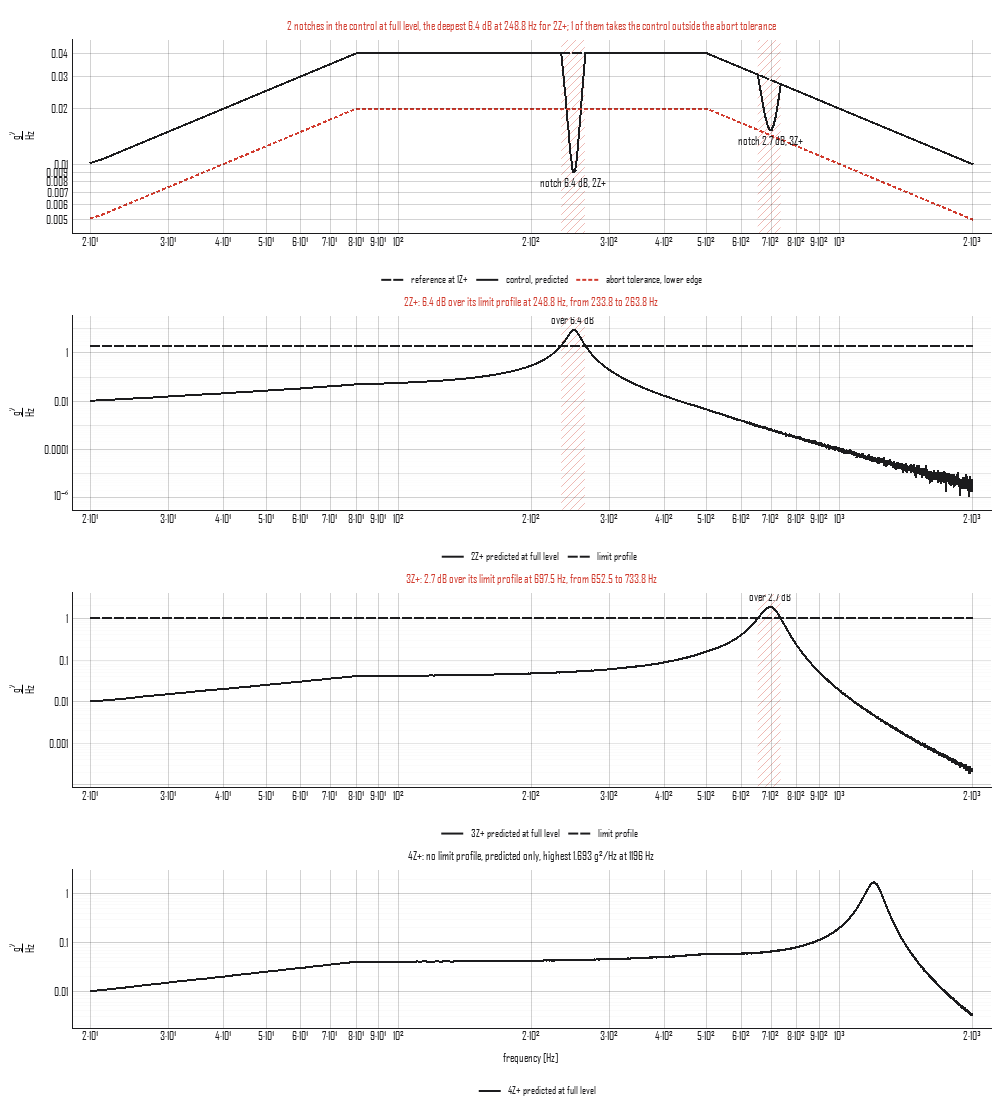
The figure is a low-level run 12 dB under a profile that rises at 6 dB
an octave from 0.01 g²/Hz at 20 Hz to 0.04 from 80 to 500 Hz and falls
at 3 dB an octave to 0.01 at 2 kHz, within plus or minus 3 dB, read at
1.25 Hz lines with Hann frames at half overlap
(tools/make_concept_figures.py). A bracket at 2Z+ has a mode at
250 Hz with a Q of 15 and may see 2 g²/Hz; a second point at 3Z+ has a
mode at 700 Hz with a Q of 8 and may see 1 g²/Hz; a monitor at 4Z+ has
no limit. At its peak the bracket's transmissibility squared is about
226, so at full level it would see about 9 g²/Hz, 6.5 dB over its
profile: the predicted notch is 6.4 dB deep at the line nearest the
peak and takes the control 3.4 dB under the abort edge. The second
point's notch is 2.7 dB deep and stays inside. The reference is
dashed, the predicted control solid and the abort edge dotted; each
notch is hatched and labeled with its depth and the channel that cuts
it, and each limit channel's rows hatch the band where it is over.
In the app
Select the low-level run's FRF (computed against the control channel) together with the specification written at that channel, and press Notch Prediction on the bar. If the limit profiles are held in a spectrum of their own, select it as well. The control is drawn on top with every predicted notch hatched and labeled, and a row under it for each response channel, its predicted response against its limit profile. Each row's title is its reading in words.
The panel beside the plot holds the one choice the reading takes, the tolerance pair a notch is read against, and under it the verdict, a row a notch in a table (its band, its depth in dB with the ratio, and whether it leaves the tolerance; the whole notch in words on each row's tooltip), and the reading in words: each notch with the control left at its deepest line and the channels that cut it, each channel over its profile or how close it comes, and the notes. The status line carries the verdict.
The button is offered only where the reading applies: an FRF whose
records are all against one channel, beside a specification written at
that channel in the quantity the FRF is against. An FRF from the
drives, against volts, is not a transmissibility from the control
channel and does not offer it. The reading is journaled as the
plot_limit_prediction call that draws it.