Judging a replication by segment
A replication test plays a measured record back on the shaker, and the controller reports how closely it came as one number over the whole record. That number can look fine while the one event in the record most likely to break something was missed. This page describes how Visual Dynamics judges a replicated run segment by segment, each segment by the rule for its kind of motion, and how to run the judgment from a script.
Why the whole record hides a segment
replication.compare and the Waveform Error reading of the
transient workflow give the rms of
the difference between the run and its reference as a share of the
reference's rms, over the whole playing. A short event holds a small
share of a long record's mean square, so a large error on it moves
that figure very little. In the record drawn below, a pothole of
0.8 s in a minute of rough road holds 1.5 percent of the record's mean
square. The run misses most of the pothole's 250 Hz ring, an error of
17.5 percent on the pothole itself, and the whole-record figure still
reads 4.87 percent.
The whole-record shock response spectrum does not help either. A maximax spectrum over the record keeps each oscillator's largest response anywhere in it, and an oscillator near 250 Hz may answer more strongly to the rough road or the braking than to the pothole, so the spectrum is set by a different event and never sees the shortfall.
The segments and their rules
The record is cut into segments, each marked with the kind of motion it is, and each segment is held to the tolerance of its kind. The tolerances below are the defaults. They are examples of what test documents ask for, not any one document's requirement, and the test plan states the ones that apply.
| Kind | What it is | Judged by | Default tolerance |
|---|---|---|---|
| stationary | statistics that hold steady: a rough road at a constant speed | its ASD against the reference's, line by line; its mean square against the reference's | ±3 dB at every line; up to +10 % |
| transient | a long non-stationary stretch, its spectrum steady while its level changes: braking, a run-up | its short-time rms envelope against the reference's, window by window; its normalized ASD, the segment's own mean square divided out | ±1 dB in every window; ±3 dB at every line |
| shock | a short event: an impact, a pothole | its shock response spectrum in each polarity against the reference's; its major peaks, the reference's largest crests and troughs, against the control at the same samples | −6/+3 dB at every point; ±20 % at each peak |
A few details are fixed by the judgment and worth knowing:
- The taper. A stationary or transient segment is weighted by a tapered cosine window before its ASD and its mean square are computed: 10 percent of the segment by default, half rising at the start and half falling at the end, the middle weighted by one. Without it the segment's abrupt ends would enter its spectrum as content the record does not have. A shock's SRS is computed on the segment as recorded. The SRS is a peak response, and a shock marked tight on its event would put the event's first and largest cycles under the taper; both traces would be weighted down there alike, and a miss would shrink in their ratio. Marked from 31.99 s, the pothole below would read 3.2 dB low at worst under a taper and pass; read as recorded it is 7.4 dB low and fails. The envelope and the peaks are read on the segment as recorded too, because they are ratios of the two traces at one place, from which a weight on both cancels.
- The test band. The run and the reference should be band-limited
alike to the test band before they are judged
(
visualdynamics.core.filters), and the same band should be given to the judgment asband. The ASD is then judged at the lines inside it and the SRS computed at natural frequencies across it, up to a fifth of the sample rate. Outside the band the reference holds only the filters' skirts, and a control that leaks a little there reads decibels over without having missed anything. A line or a point more than 40 dB below the reference's highest is not judged, for the same reason. - The ASD. Each segment's ASD is the package's own averaged
periodogram (
TimeHistory.compute_psds), Hann frames at half overlap with 1 Hz lines by default (lines). A segment shorter than one frame is one frame. - The envelope. The window and its step are one percent of the whole
record unless
windowis given, in seconds; test documents commonly ask for no more than that. Only whole windows from the segment's start are read. - The major peaks. Two each way by default (
peaks), and never more than a tenth of all the reference's peaks in the segment, never fewer than one each way. - The mean square. A stationary segment's variance is its mean square
about zero. Test documents commonly write only its upper edge; a
segment that falls short is an undertest, and the ASD band already
holds it from below. A lower edge can be given as
variance_percent=(-10.0, 10.0).
A segment passes when every one of its checks does, and the record passes when every segment does. A check with nothing to judge, such as an SRS when the test band lies above a fifth of the sample rate, is not judged, and its segment is not judged unless another of its checks fails; the record's line counts such a segment apart and does not call it a pass. A control that holds nothing where the reference asks for something reads minus infinity decibels there and fails. A trace holding a NaN or an infinity is refused with an error. Each check reports its readings, how many fell outside its tolerance, and its verdict.
In the app
Select a run and the transient specification it was controlled to,
and choose Segments on the bar, beside Waveforms and
Waveform Error. The plot is the picture below, at the channel and
playing chosen on the bar. The panel beside it holds the marks, a row
each with where the segment starts and ends on the reference's clock
and its kind, with buttons to add and remove one; then the taper, the
test band when ticked, and the tolerances of the kinds that are
marked. Under them are the whole-record rms error and each segment's
verdict, with the checks it failed. Every edit redraws the judgment
at once. The marks are kept on the reference, as its segments, so
they are saved with the project and come back when the reference is
selected again. Nothing is made, so there is no Apply button; the console
records the plot_replication_segments call that draws what is on
screen. The waveform grid under the plot still holds every channel at
every playing.
From a script
from visualdynamics.core.replication_segments import replication_segments
from visualdynamics.plot import plot_replication_segments

# the reference is the record the run was controlled to, as a
# TransientSpecification; the run is the control trace as recorded
marks = [(6.0, 30.0, 'stationary', 'rough road'),
         (31.9, 32.7, 'shock', 'pothole'),
         (41.0, 51.0, 'transient', 'braking')]

result = replication_segments(run, reference, marks, band=(5.0, 400.0),
                              window=0.5)
print(result.describe())
for segment in result.segments:
    print(segment.describe(), f'{segment.share:.2f} % of the record')
    for check in segment.checks:
        print('   ', check.describe())

# the tolerances are arguments: a looser peak rule, a tighter SRS band
strict = replication_segments(run, reference, marks, band=(5.0, 400.0),
                              srs_db=(-3.0, 3.0), peak_percent=30.0)

plot_replication_segments(run, reference, marks, band=(5.0, 400.0),
                          window=0.5, path='segments.png')
judge_segments in the same module is the judgment on two plain
arrays, already aligned; replication_segments takes the run and its
reference as objects, at a channel and over one playing, and aligns
them by the one shift the transient workflow's comparison uses.
tapered_cosine and major_peaks are the window and the peak rule on
their own. Marks set in the app are the reference's segments, and
replication_segments(run, reference, reference.segments) judges by
them.
The picture
plot_replication_segments draws the reference standing back in gray
and the run over it, the difference between them beneath on the same
time axis, and each segment shaded across both. Each segment is
labeled with its name, its kind and its verdict, and its edges are
drawn solid for a stationary segment, dashed for a transient and
dotted for a shock. A failing segment's fill is red where a passing
one is blue, which adds to the words and replaces none of them. The
table under the plot gives the whole-record rms error first, then each
segment's span, its share of the record's mean square, its own rms
error and each check against its tolerance, a failing verdict in bold.
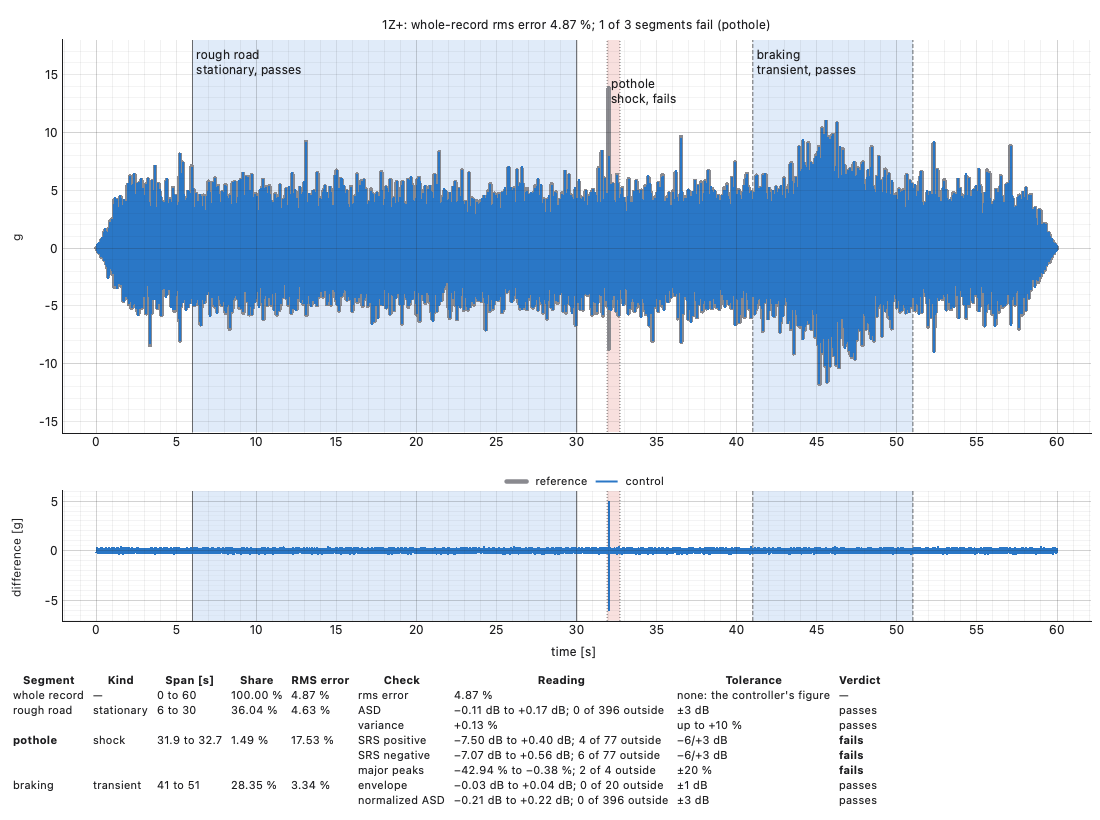
In the figure the whole-record rms error is 4.87 percent. The rough road's ASD lies within 0.17 dB of the reference's from 5 to 400 Hz and its mean square 0.13 percent over, and the braking's envelope within 0.04 dB in all 20 windows: both pass with room. The pothole fails three ways: its spectrum is 7.5 dB low at worst in the positive polarity and 7.1 dB in the negative, at the top of the range where the 250 Hz ring was under-driven, and two of its four major peaks are more than 20 percent short. Only the segment-by-segment reading shows it.