Comparing signatures before and after a test
A low-level survey of the test article, run before the full-level test and again after it, is the article's structural signature. Laid over each other, the two say whether the article changed: a mode that has dropped in frequency has lost stiffness, and one that has lost height has gained damping or moved its motion somewhere else. The overlay shows that. Whether it matters is decided by a criterion written before the test, mode by mode, and this page describes that comparison in Visual Dynamics and how to run it from a script.
What is compared
A signature is any curve of one quantity against frequency at one response point: an FRF, a transmissibility (an FRF of acceleration over acceleration), or the level a tracked sine sweep reads. The signature before and the signature after are measured the same way: the same level, the same channels, the same resolution or sweep rate. They do not have to share their frequency lines, and a sweep read downward is read the same as one read upward. They do have to be of one quantity: an accelerance compared with a transmissibility is refused, since the two heights are not on one scale.
The modes compared are named by a frequency near each, and by whether each one counts. The modes that count are usually the global modes, in which a large share of the article's mass moves; a local mode, a bracket, a panel or a cable, shifts when a clamp is re-seated and means little. The test plan names them. A mode that does not count is still reported, with its shifts, and is not judged.
The rule
- The window. Each mode is read inside a window about the frequency
it is named at: a fifth of that frequency either side by default
(
search=0.2), stopped halfway (on a log scale) to the next mode named, so two modes named close together are read apart. A mode can be given its own window withSignatureMode(f, within=(low, high)). - The reading. On each curve the mode is the tallest line in its window. Its top is placed between lines by a parabola through the logarithms of that line and its two neighbors, and its Q is read from the half-power width, the two crossings of 0.707 of the top. It is the same reading as the half-power readout.
- The shifts. The frequency shift and the amplitude shift are in percent of the reading before the test, negative for a drop.
- The verdict. A mode that counts passes when both shifts are inside their limits, and is flagged when either is outside. A shift on a limit's edge is inside it. The comparison passes when every mode that counts passes.
- The notes. A reading that cannot be fully trusted says so, and the comparison keeps every note beside its verdict: the tallest line on the window's edge (the mode may have moved out of its window), a top placed outside the window, lines that hold no value (NaN), a half-power width that cannot be read, and two modes read on one peak. A mode that has moved into its neighbor's window is read as the neighbor, and the shift it gives is not its own, so a verdict with notes needs a look at the plot.
The limits default to plus or minus 5 percent in frequency and plus or
minus 20 percent in amplitude, as an example of what test documents
ask for. The test plan states the numbers. A limit written as a pair,
amplitude_limit=(-30.0, 10.0), holds a drop and a rise to different
values.
A peak read on a transmissibility sits a little below the mode's natural frequency, by about one part in four Q squared. It sits there the same way before and after, so the shift between the two readings is the mode's.
In the app
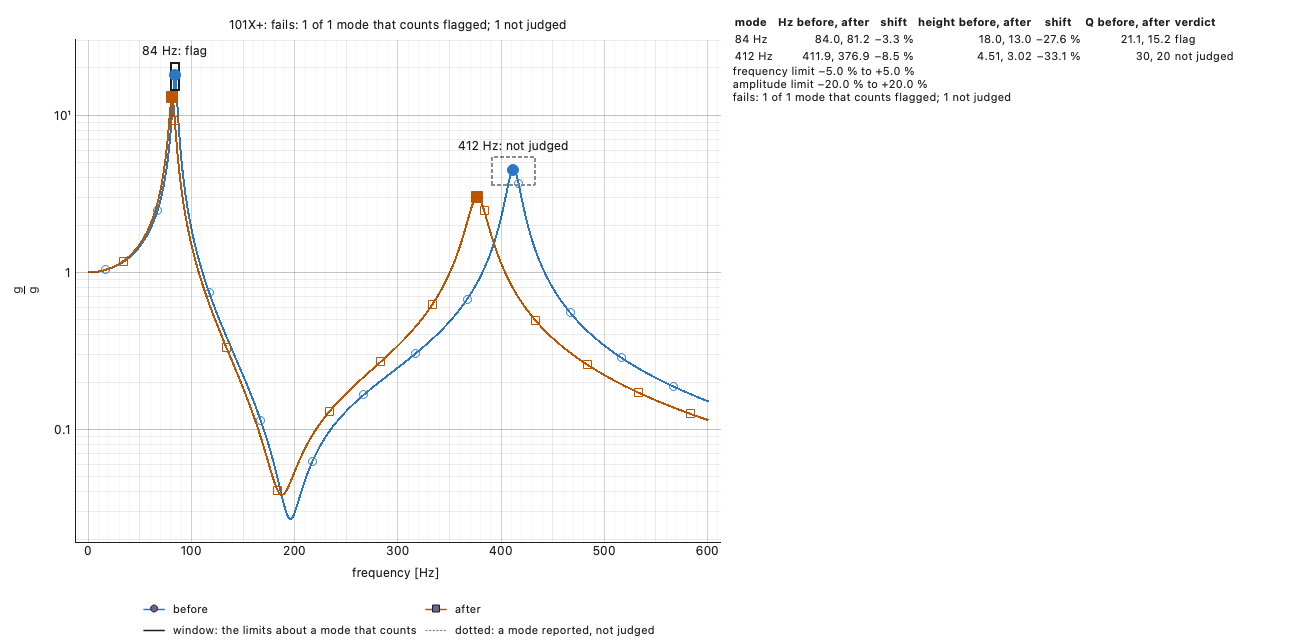
Select the two signatures together (two FRFs, or two tracked sweep levels) and choose Signature on the plot's bar. The two curves are drawn over each other, the signature before with hollow circles and the one after with hollow squares, and each mode's peak is marked with its curve's marker filled. A window is drawn about each mode's peak before the test: as wide as the frequency limit and as tall as the amplitude limit, so the peak after passes when it lands inside. A mode that counts has a solid window and its verdict written over it; a mode that does not count has a dotted window and the words "not judged".
The Signature panel beside the plot holds the settings and the table:
- Before: which of the two selected is the signature before the test.
- Modes [Hz]: the modes, a frequency near each, separated by
commas, with a mode that does not count in parentheses:
84, (412). Empty, the most prominent peaks of the signature before are found (Peaks found says how many) and all of them count. Selecting another pair clears the field, so the new pair's own peaks are found. - Frequency [±%] and Amplitude [±%]: the limits.
Under them the panel gives the verdict and, for each mode, its frequency, height and Q before and after, with the two shifts and the mode's notes. The status line gives the verdict, the number of notes and the first of them. Every edit redraws the plot. When the signature before holds several records, the box on the bar picks the one compared, and the record after is the one at the same DOF.
From a script
from visualdynamics.core.signature import SignatureMode, compare_signatures
from visualdynamics.plot import plot_signature

modes = [84.0, SignatureMode(412.0, counts=False)]
result = compare_signatures(before, after, modes)
print(result.describe())
for shift in result.shifts:
    print(shift.mode.label(), shift.describe(),
          shift.before.q, shift.after.q)
for note in result.notes:
    print(note)
plot_signature(before, after, modes, path='signature.png', show=False)
For the two-mode article below, measured at one point before and after a test, this prints:
fails: 1 of 1 mode that counts flagged; 1 not judged
84 Hz 84.0 to 81.2 Hz (−3.3 %), height 18.0 to 13.0 (−27.6 %, outside): flag 21.05... 15.19...
412 Hz 411.9 to 376.9 Hz (−8.5 %), height 4.51 to 3.02 (−33.1 %): not judged 30.00... 20.01...
The first mode has moved 3.3 percent in frequency, inside 5, and lost 28 percent of its height, outside 20, so the comparison fails on amplitude alone. The local mode has moved further on both counts and is reported without a verdict, because the plan leaves it out.
compare_signatures takes record= and after_record= to choose the
records, frequency_limit=, amplitude_limit= and search=. For two
curves held as plain arrays, signature_shifts(frequencies, before,
after, modes) is the same comparison, with after_frequencies= when
the two were measured on different lines.
find_modes(before, count=2) returns the most prominent peaks of a
record, ranked the way the modal fit's suggestion ranks them, by how
far each stands above its surroundings rather than by height. Its
answer is a suggestion; which modes count is the plan's. The modes a
modal fit has confirmed can be compared directly by passing its shape
set as the modes (a rigid-body mode at 0 Hz is left out):